image by Jennifer
Wagner
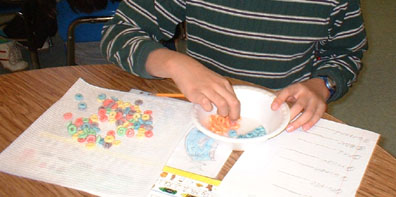
Our ESL students participated with more than 100 schools across the United States and abroad counting froot loops. We were trying to determine which color froot loop would be the most common. The hypothesis for the Froot Loops to the Max project is that orange froot loops are the most numerous. Our students divided the froot loops by color, tallied the numbers, graphed the froot loops and then recorded them on an online database to determine whether the hypothesis was correct.
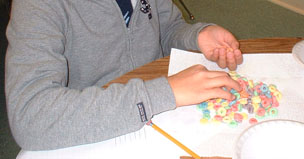
Here we are sorting and counting the froot loops
 |
 |
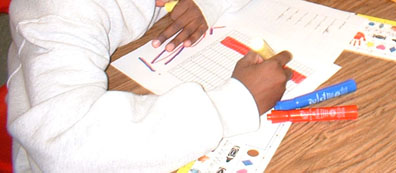
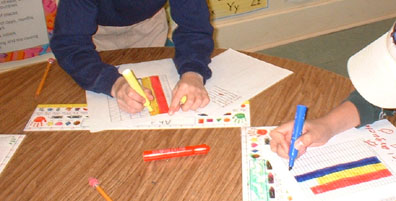
We graphed our results by hand
|
 |
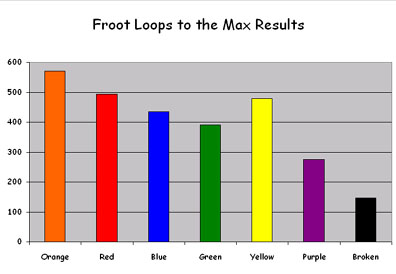
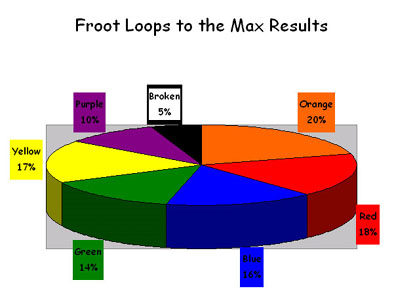
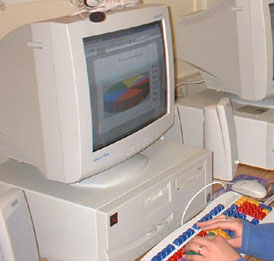
We used Microsoft Excel to graph our results
"Did the color orange come out on top?"
Our class counted a total of 2,789 froot loops with the color orange
appearing most-571. Red came in second with 493 and yellow was close
behind with 478. We counted 435 blue and 390 green loops. Purple came in last with only 275 froot loops in the box. There were also 147 broken froot loops in our box.